Applications / Presentations
Presentations
NTWRK presentations are built in HTML from the brand tokens: one 1920 x 1080 canvas, 13 layouts and a template that runs in any browser, offline, with a presenter view, and exports a PDF with one slide per page. Every slide below comes from the working template, which is the approved house format for NTWRK decks.
01Deck principles
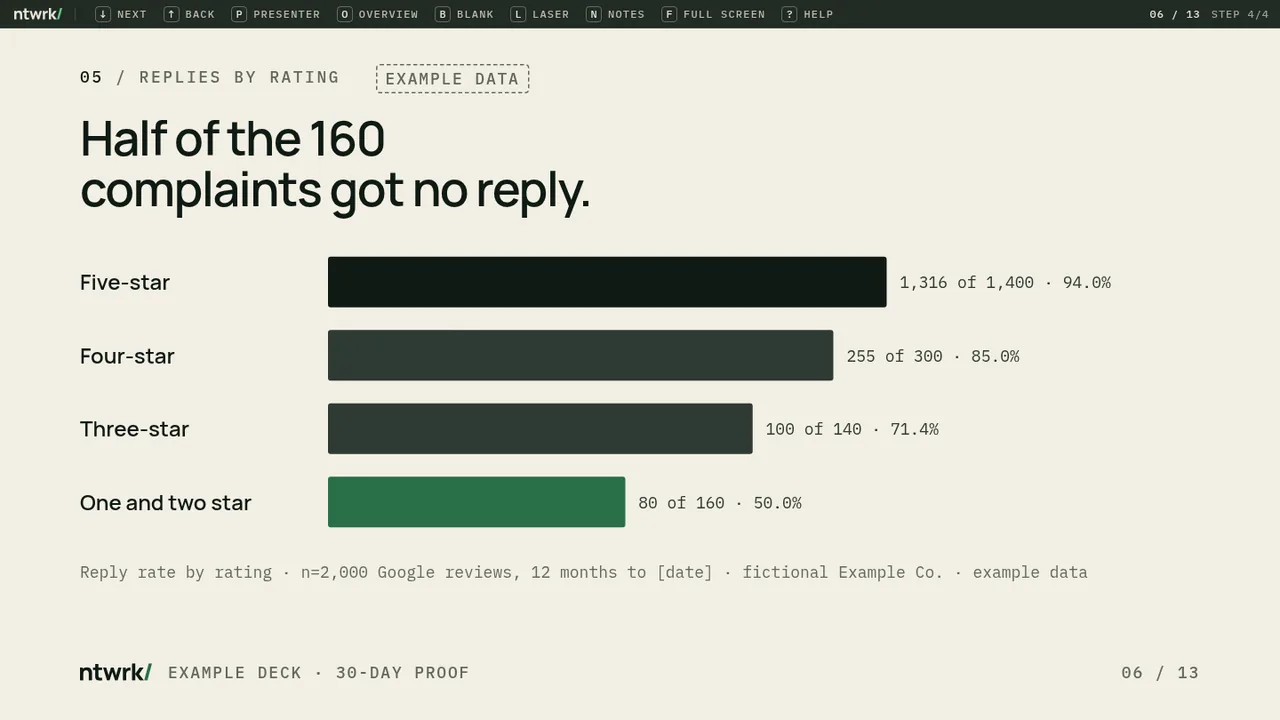
- One idea per slide. The headline is the point (“Half of the 160 complaints got no reply.”), not a topic label (“Review analysis”). If a slide needs two headlines, it is two slides.
- Evidence over adjectives. Every number has its denominator, period and source on the same slide. Example data is tagged as example data.
- The reader is the subject. Claims open on “you” or on the finding. Sales decks may say “we”; field note decks follow the editorial rule.
- en-AU. Australian spelling, “5 October 2026” dates, ranges with “to”, no em or en dashes. See Tone and voice.
- Quiet slides. One Forest element per slide, no stock photography, no clip art, no motion beyond a 150ms fade and build steps that reveal one part at a time.
- Close on one ask. The last slide carries the site’s primary CTA. No summary, thank-you or questions slide.
- Public by default. No client names, logos or data without written clearance. Use Example Co. in templates and training decks.
02Canvas and grid
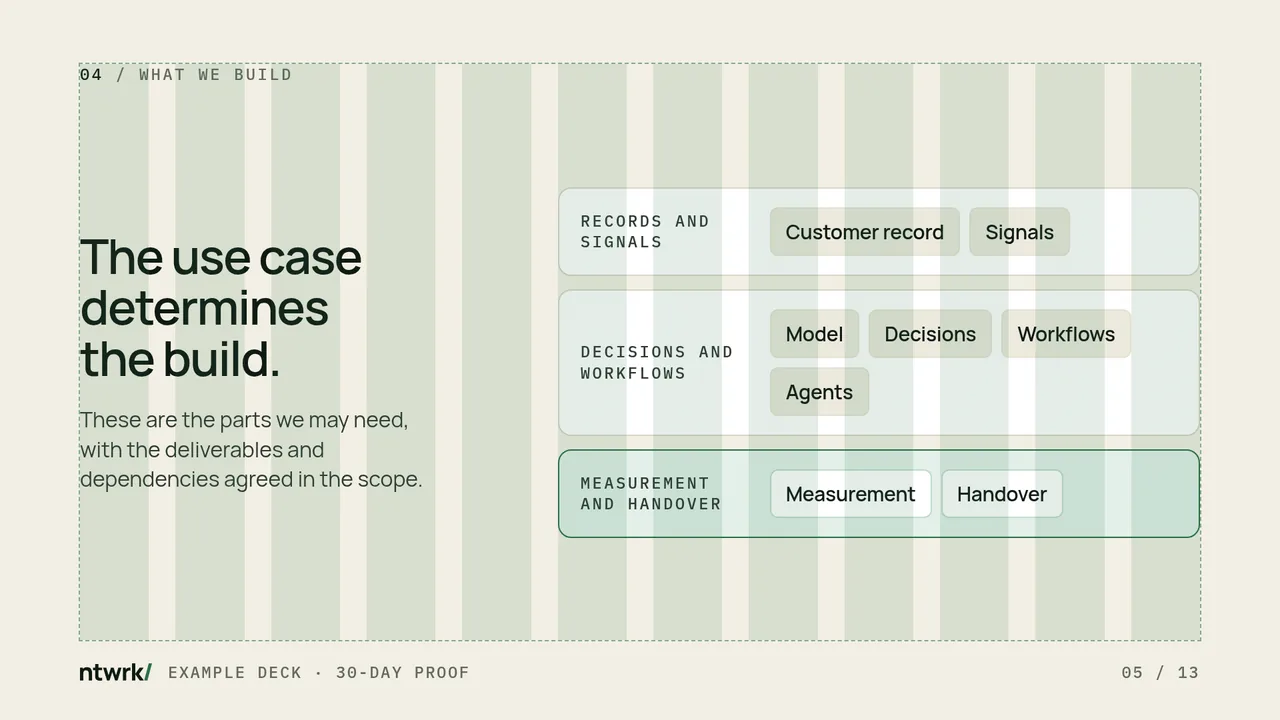
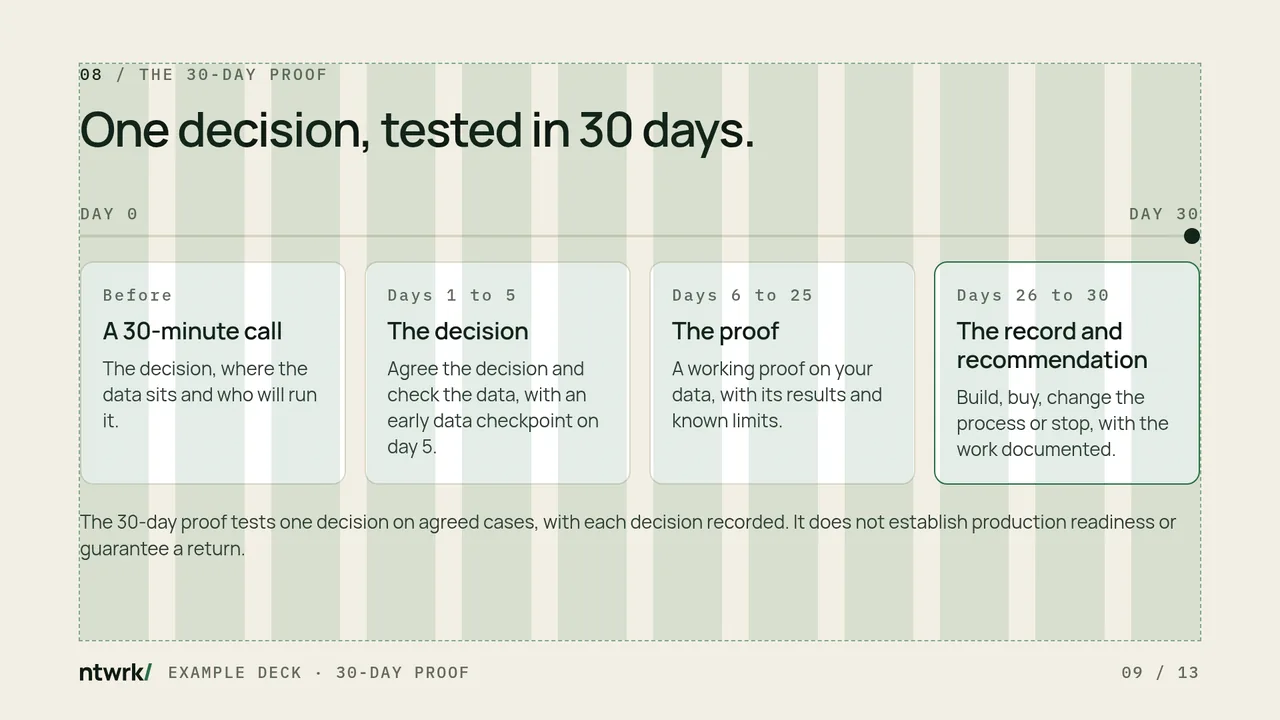
| Token | Value | Notes |
|---|---|---|
--slide-w × --slide-h | 1920 × 1080 | 16:9. Authored in canvas pixels and scaled to fit any screen. |
--slide-columns | 12 | Column 103.33px. Text and figure: copy 1 to 4, figure 6 to 12. Comparison: 8 + 4, owned first. Offer: 7 + 4. |
--slide-gutter | 40px | |
--slide-margin-x | 120px | Left and right. Keeps text out of the projector overscan zone. |
--slide-margin-top / -bottom | 96px / 120px | The bottom margin holds the footer. |
--slide-footer-baseline | 56px | Footer: wordmark, deck name, slide number “04 / 13”. |
slide group of tokens.json and generate --slide-* properties in tokens.css. The deck and the site read the same file.03Type scale for slides
| Step | Canvas px | At a 1280 share | Weight, tracking | Use |
|---|---|---|---|---|
number | 320 | 213 | 700 · −0.05em | One figure on a big-number slide |
display | 128 | 85 | 700 · −0.04em | Title and close slides, section dividers |
statement | 96 | 64 | 600 · −0.035em | Statement and quote slides |
h1 | 72 | 48 | 600 · −0.03em | Slide headline: the finding, 22 characters wide or less per line |
h2 | 48 | 32 | 600 · −0.02em | Support line beside a number |
h3 | 36 | 24 | 600 · −0.015em | Card and step titles |
lead | 40 | 27 | 400 | One line under a headline |
body | 32 | 21 | 400 | Running text, 40 characters per line |
small | 28 | 19 | 400 | Card text, captions, the bounded line |
label (mono) | 24 | 16 | 500 · +0.14em, capitals | Eyebrows, chart values, sources, footer |
- Minimum 24px for anything on a slide, including footers and chart values. That is 16px in a 1280 × 720 screen share and about 2.2% of screen height when projected.
- Body text at least 28px; chart labels at least 28px; chart values at least 24px in mono.
- If the copy does not fit at the minimum, split the slide. Never shrink type to fit.
- Manrope 400 to 700 and IBM Plex Mono 400/500 only. The template self-hosts both so decks work offline and the PDF embeds them.
04Colour: light and dark slides
| Slide | Ground | Text | Forest element |
|---|---|---|---|
| Working slides (default) | Cream --bg, white cards | Ink and ink-2; mute for labels (4.92:1) | One: the focal bar, the owned markers, the current step |
| Section divider | Surface --surface | Ink; mute labels (4.66:1) | The short bar under the heading |
| Title and close | Dark (data-theme="dark") | Cream (14.64:1) | Title: top rule. Close: the CTA button |
| Offer pricing panel | Ink panel on cream | Cream on ink (15.47:1) | None |
- Dark slides open and close a deck. Everything between is light, so projected rooms stay readable and the PDF prints cleanly.
- Lines at least 2px on the canvas. Dashed lines mean rented, expected or placeholder, as on the site.
- Never use colour alone for meaning: label the focal bar and the owned column in words.
- Chart colours follow Data visualisation: ink, Forest for the focal value, ink-2, sand.
05Slide layouts
Thirteen layouts cover the deck. Each is a class on a <section class="slide">. All slides below are 1920 × 1080 renders of the sample deck; Example Co. is fictional and every number is example data.
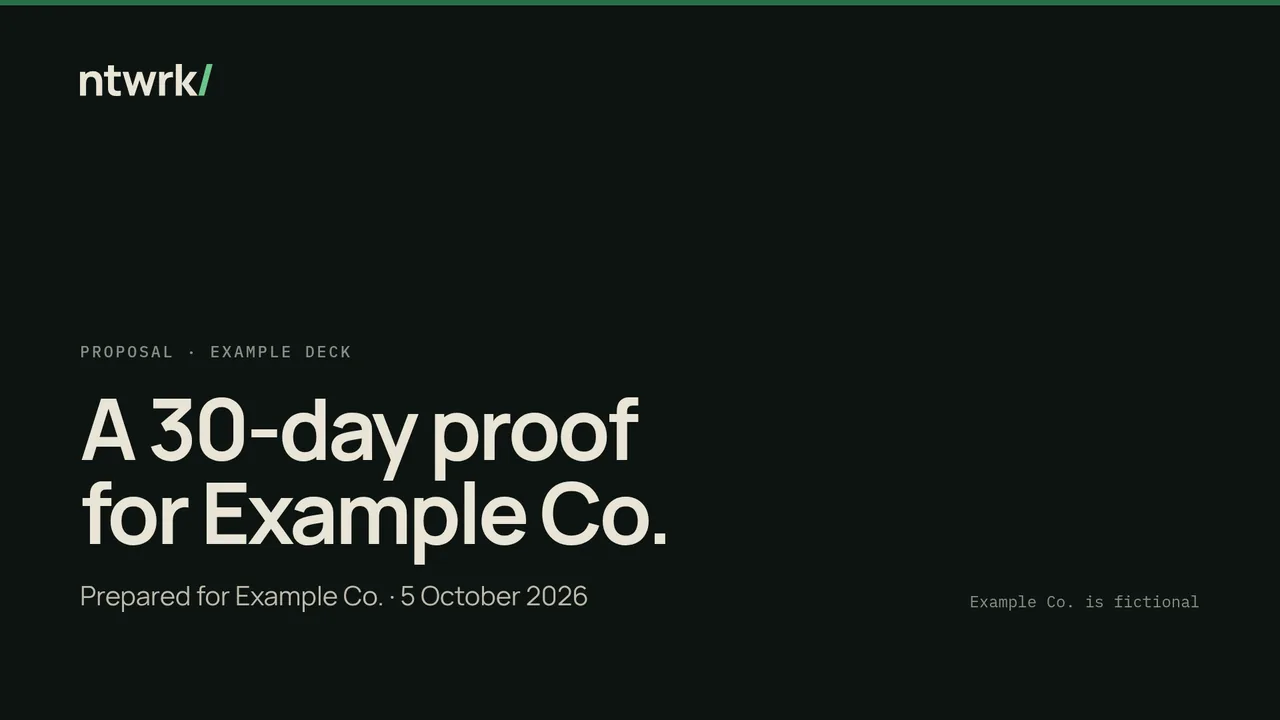
l-titleDark. Wordmark top left, one Forest rule, the decision as the title, who it is for and the date. No footer.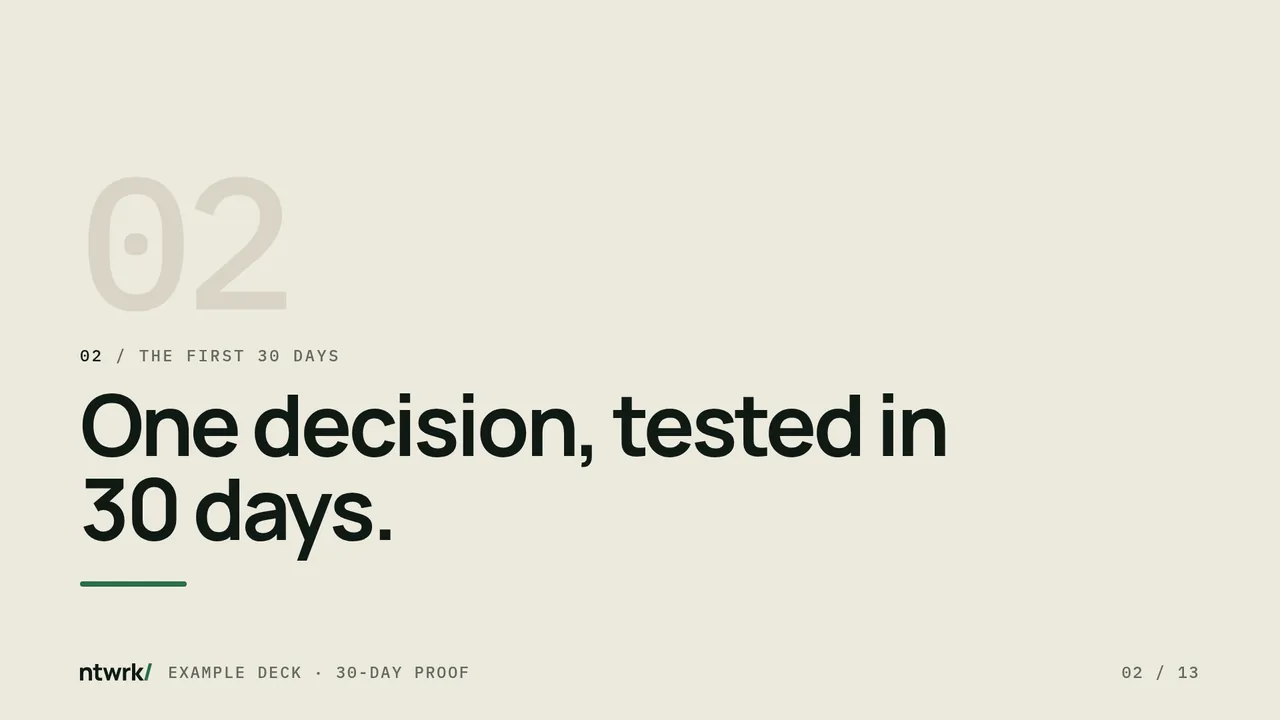
l-sectionSurface ground, section number, a kicker heading from the live site. Nothing else.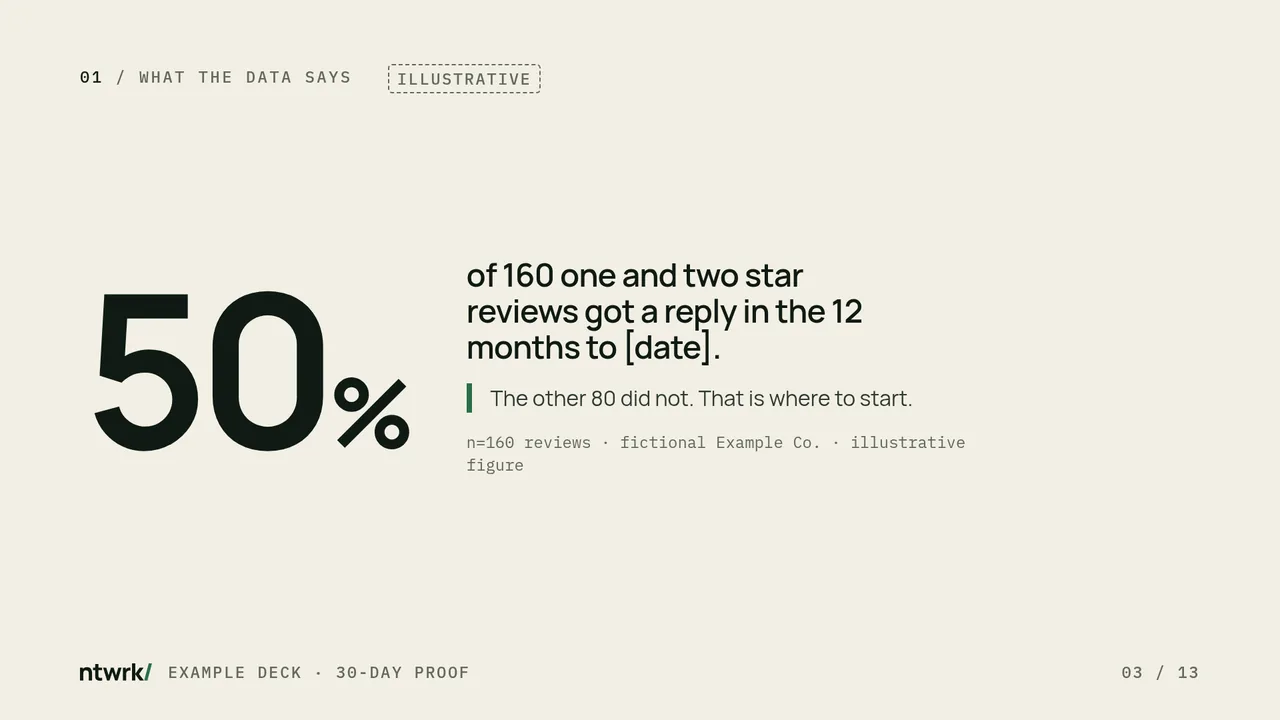
l-numberOne number with its denominator, period and source on the slide. Tag example data: use an obviously neutral figure and the Illustrative tag.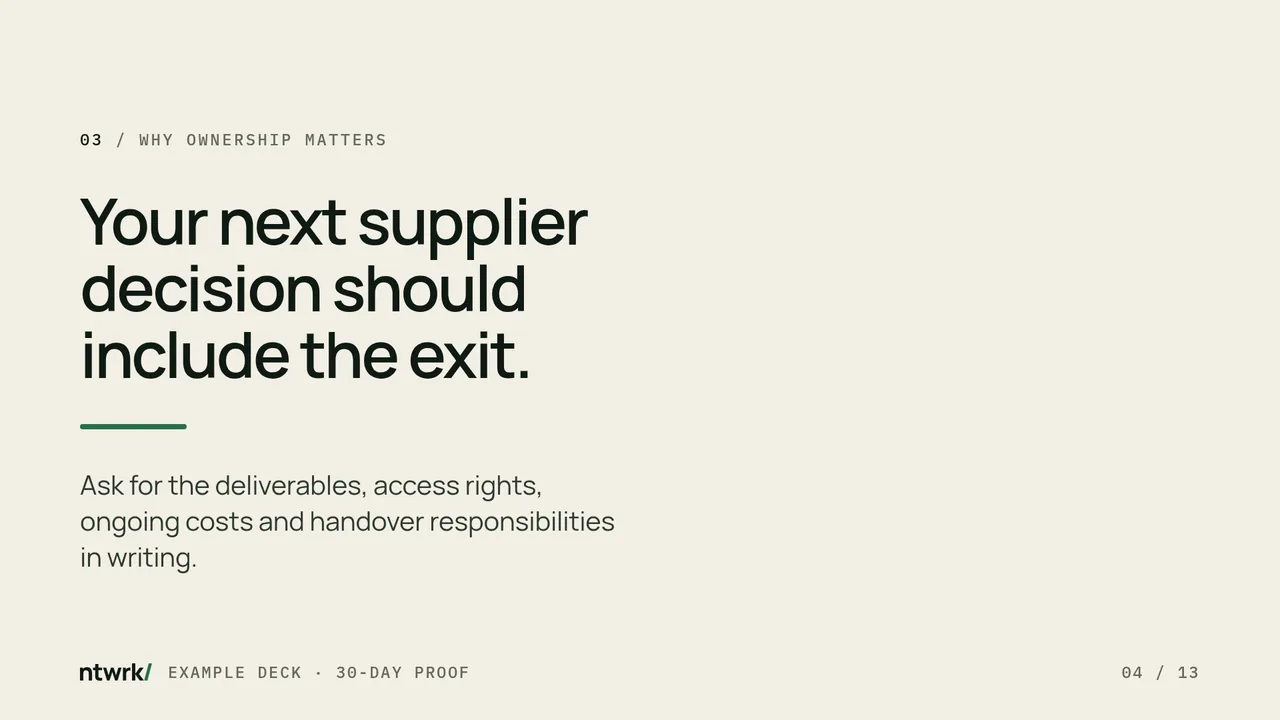
l-statementOne sentence the room should repeat. A Forest bar, then one line of support at most.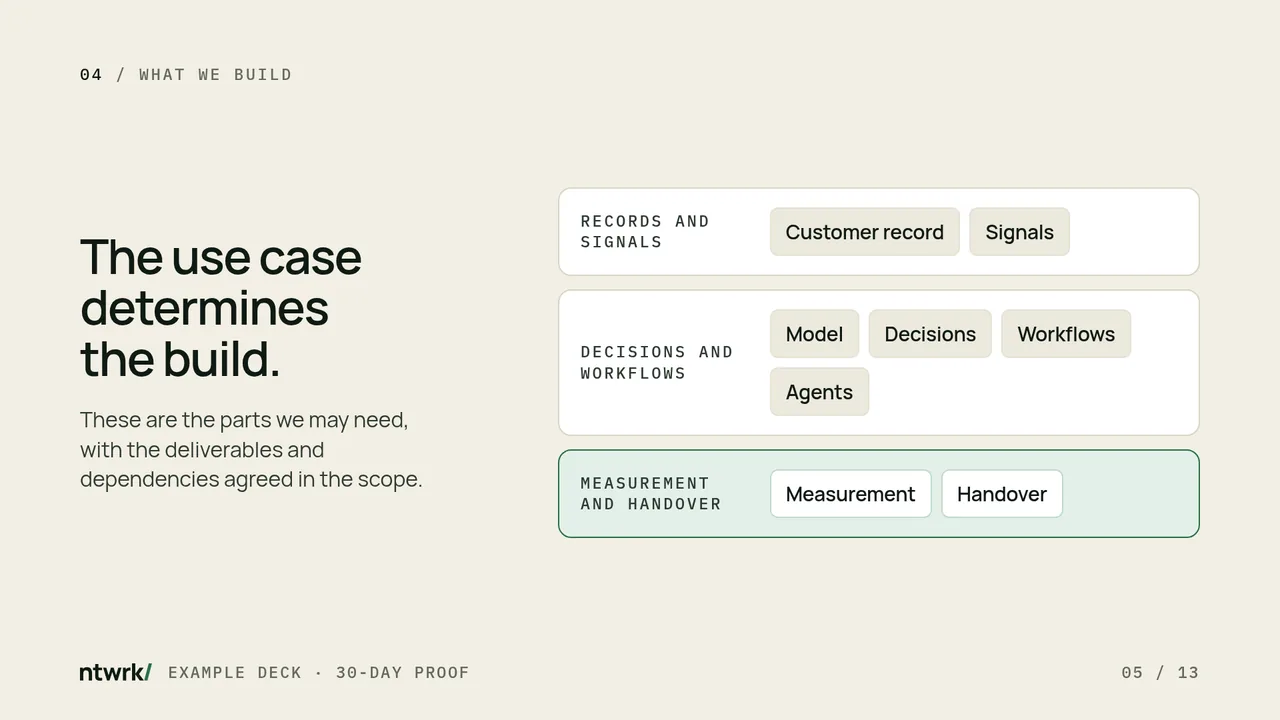
l-text-figureCopy in columns 1 to 4, an HTML figure in columns 6 to 12. The Forest group is the subject.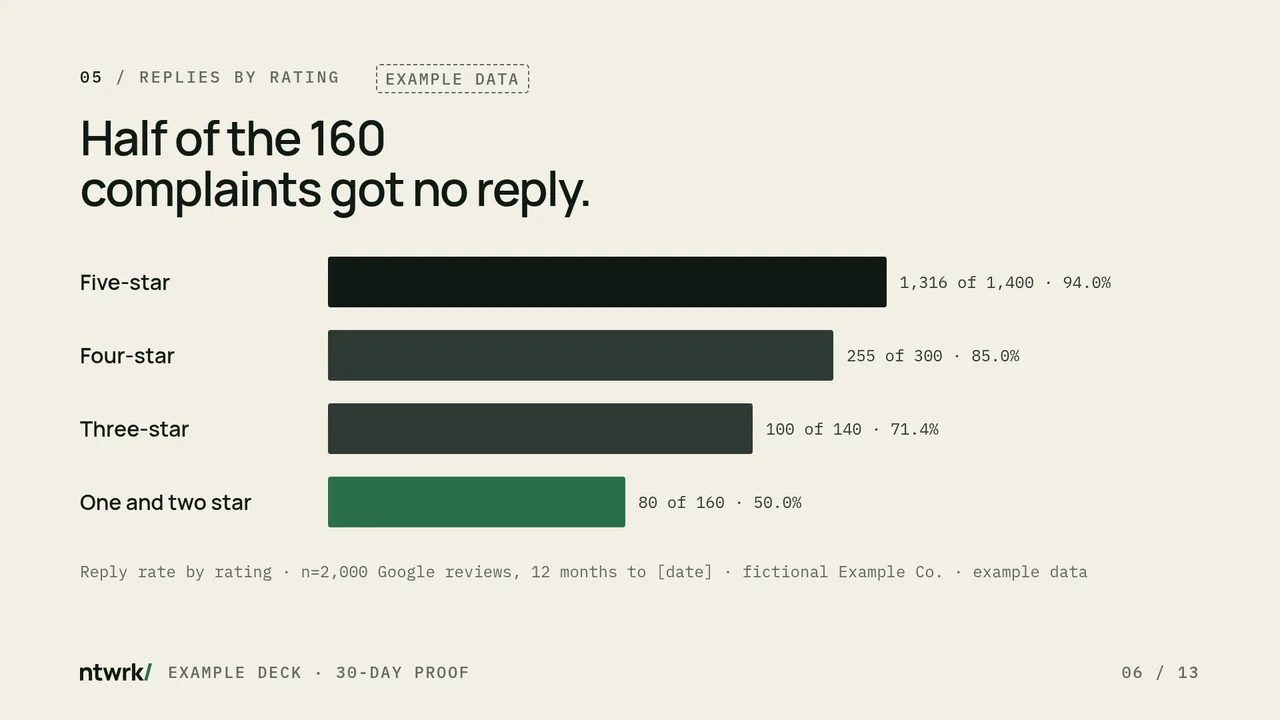
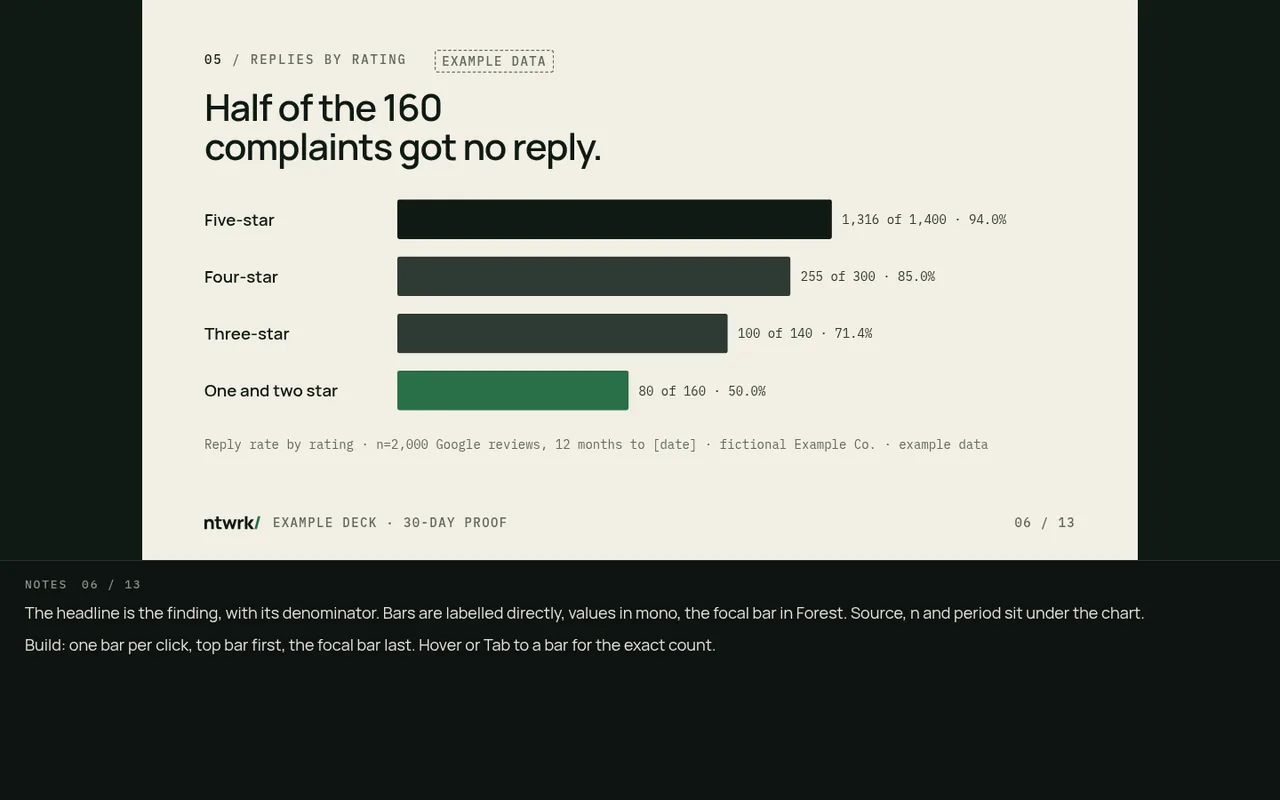
l-chartFinding as the headline, sorted horizontal bars, direct labels, mono values, the focal bar in Forest.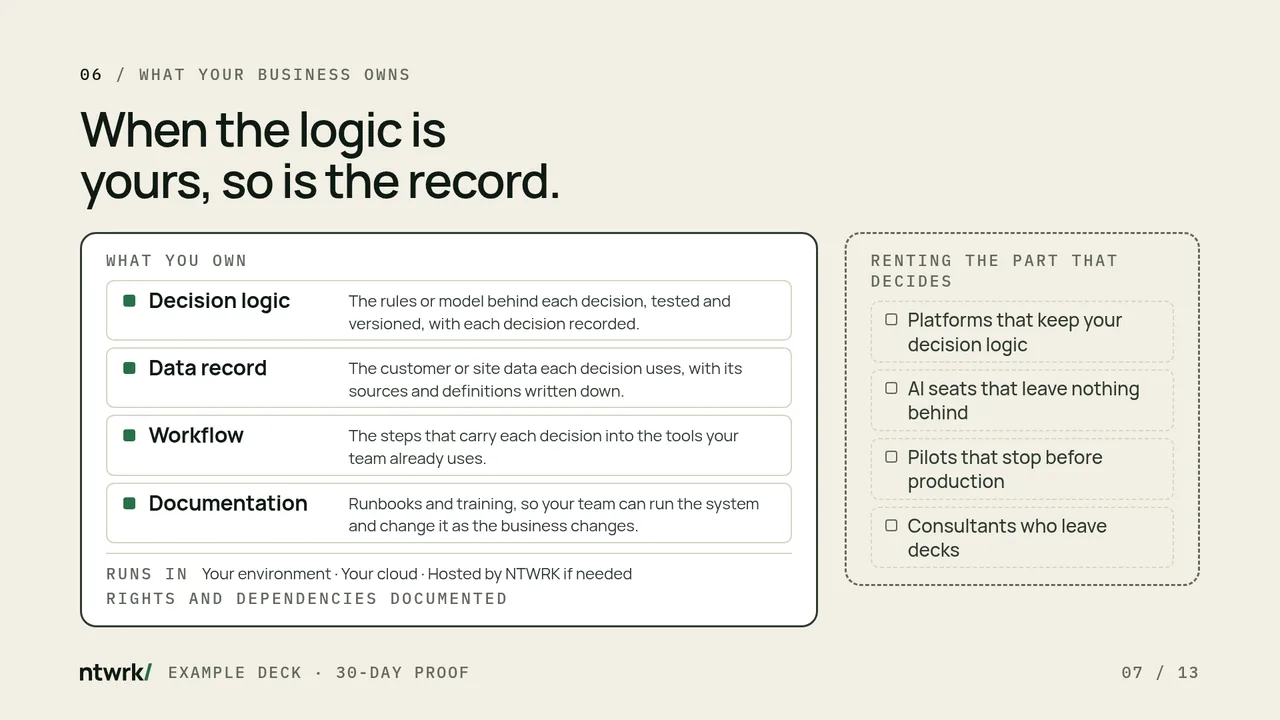
l-compareBuilt on the live Home panel. What you own leads in a solid ink frame, decision logic first, Forest on the owned markers only and Runs in as a quiet footer. Renting the part that decides sits beside it in a dashed mute frame.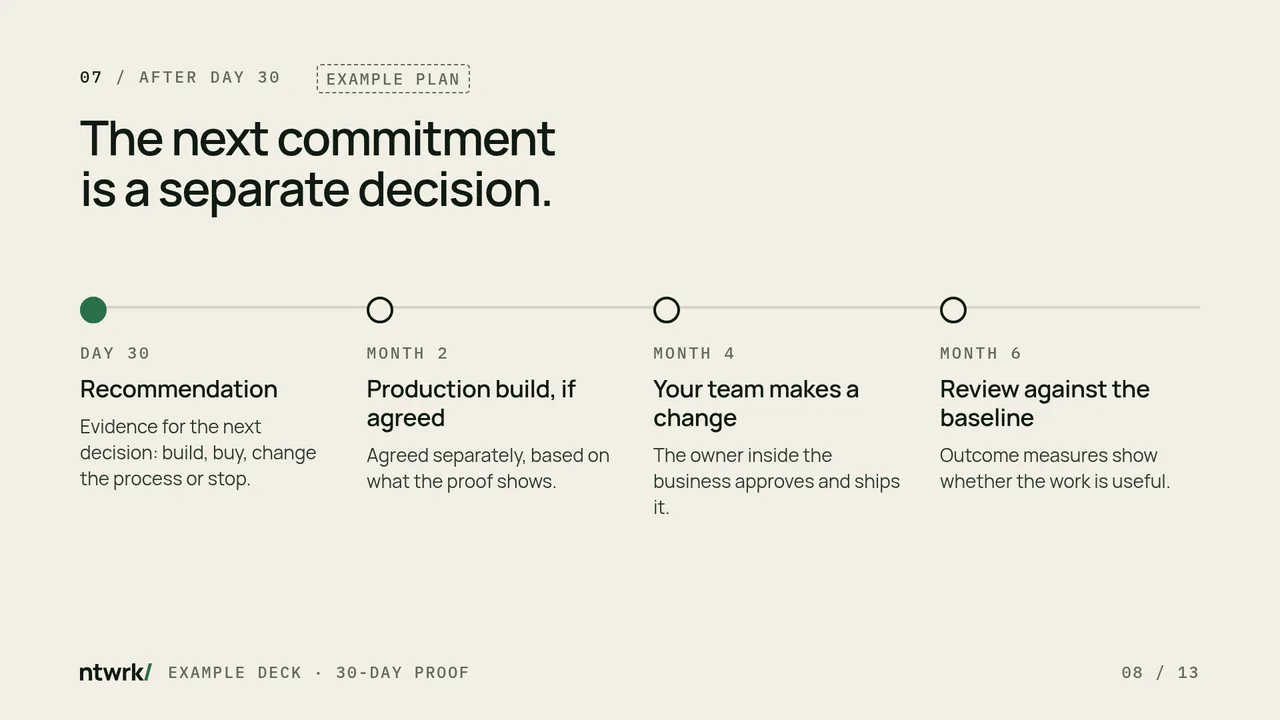
l-timelineFour dated points at most. The current point is the Forest dot. Tag example plans.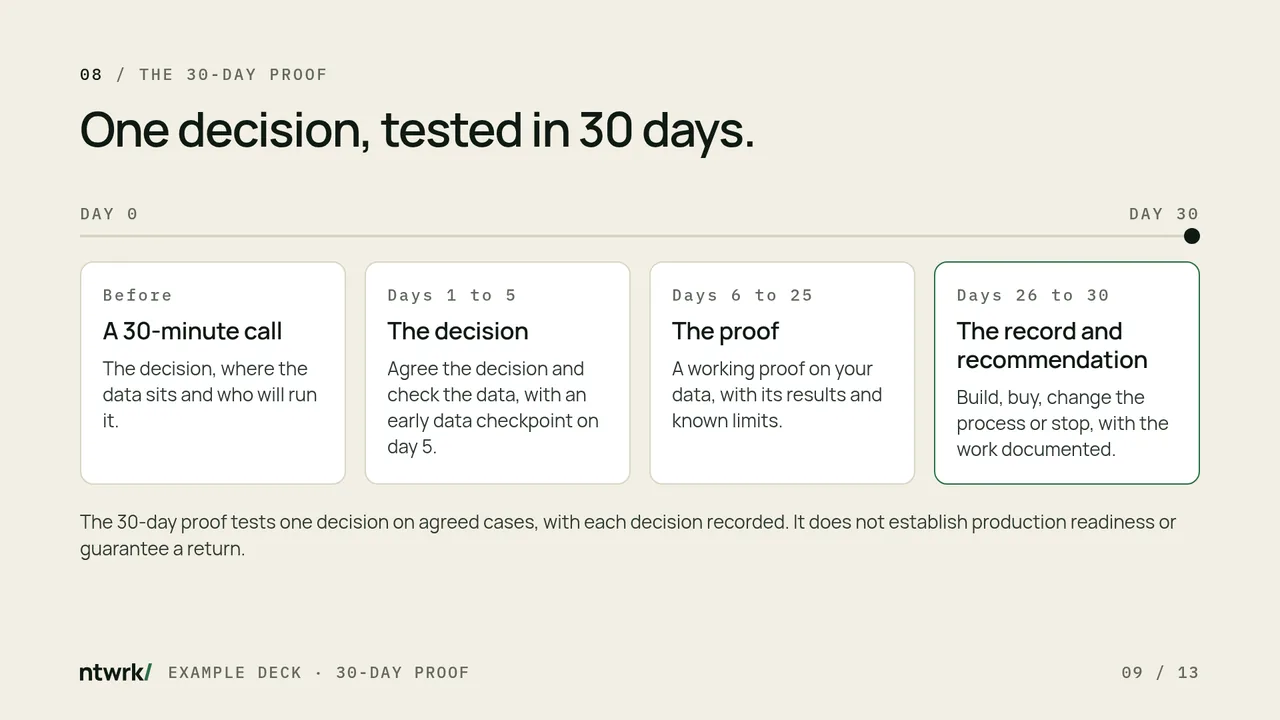
l-processThe four steps of the 30-day proof in order, with the bounded line under them.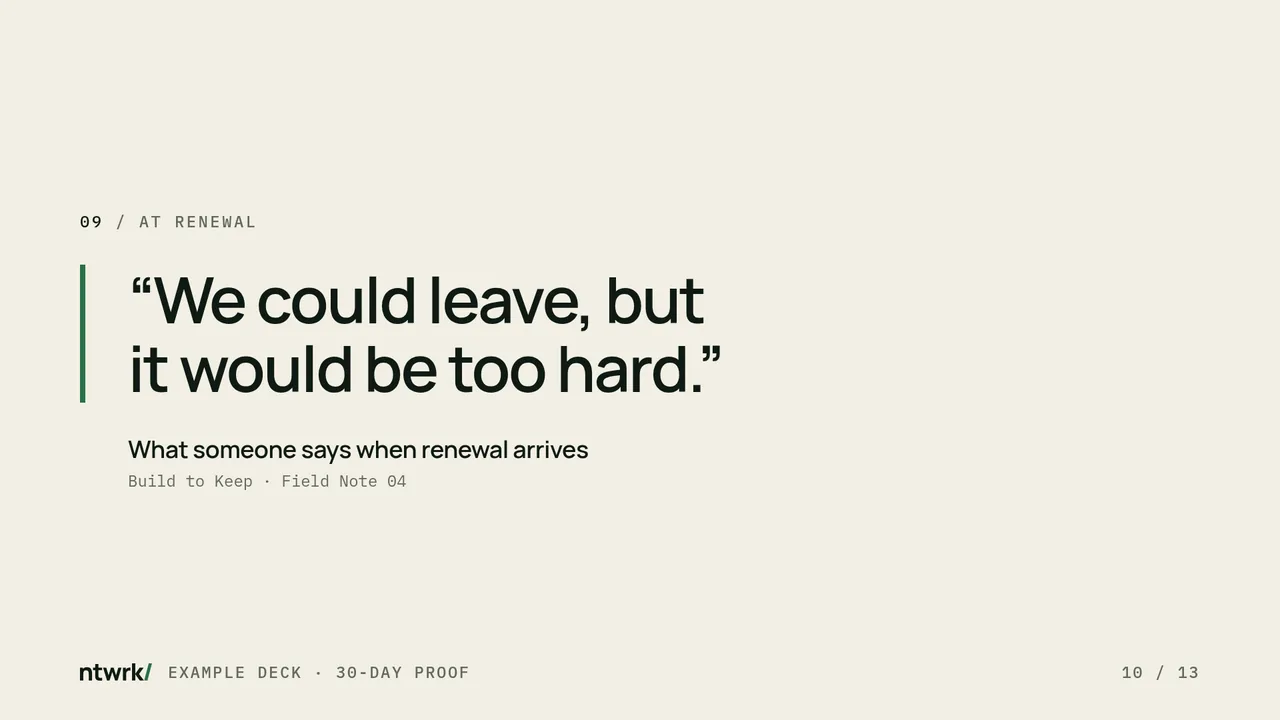
l-quoteA line someone actually says, with its source. Never a client testimonial without written clearance.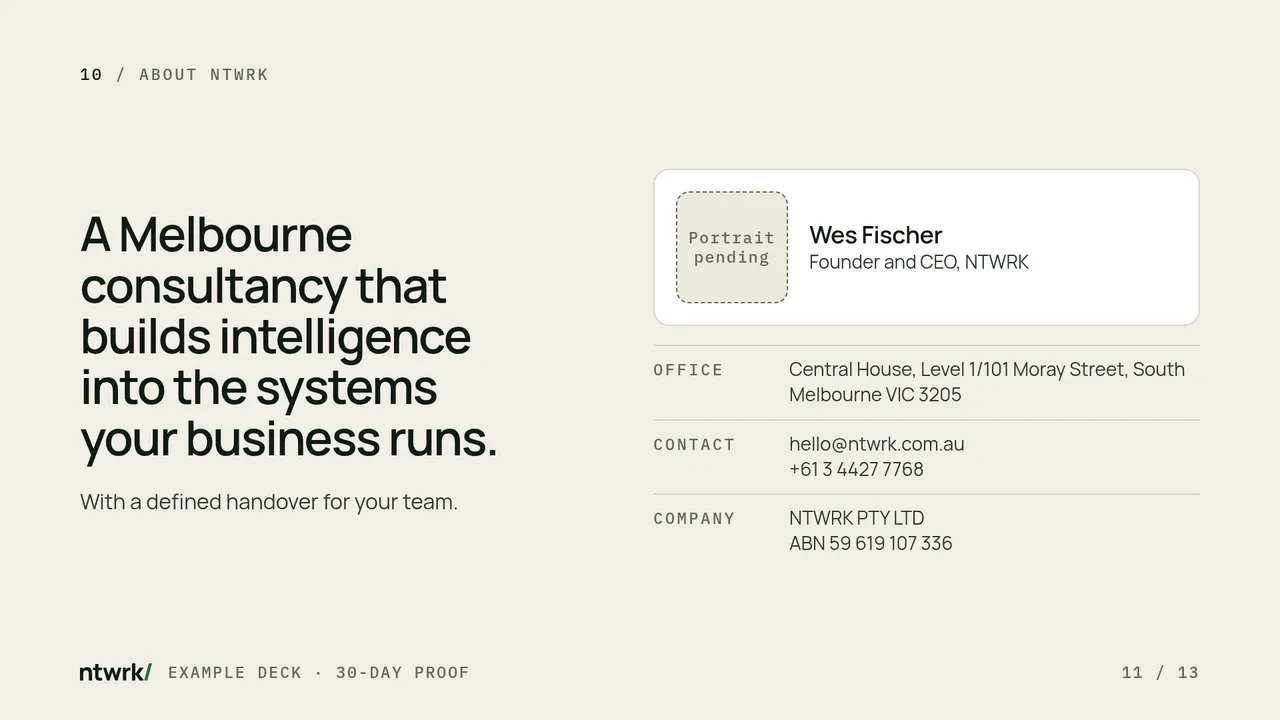
l-aboutPositioning line from the site, the founder, the public contact details.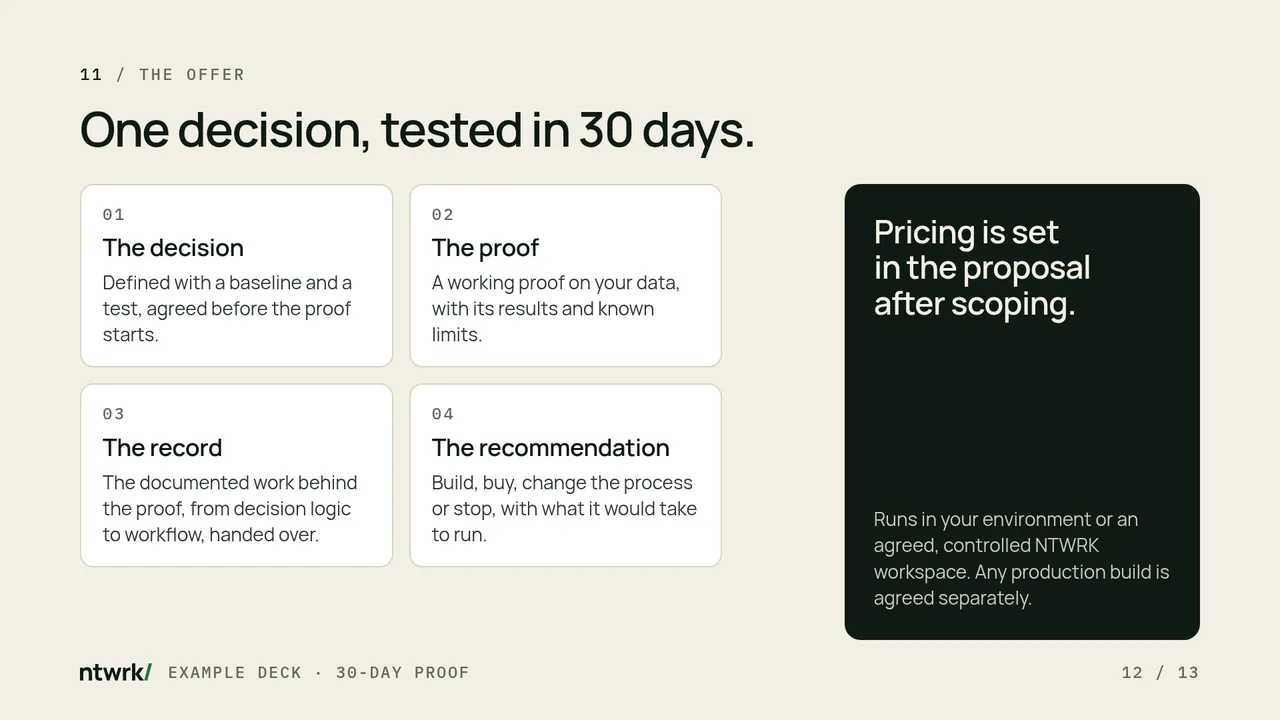
l-offerWhat the client gets on the left; the ink panel on the right carries the bound line “Pricing is set in the proposal after scoping.” No fee or dollar sign on any slide: pricing is in the proposal only. The deck tests fail on any dollar sign.
l-closeDark. One ask, the site’s primary CTA (Book a call), and the public contact details. The full CTA lead-in sits once under the button. No thank-you slide.06Charts and diagrams on slides
- The headline is the finding, with the count and the denominator.
- Horizontal bars, sorted, labelled directly at 28px or more, values in mono at 24px or more. No legends when a label fits.
- One focal value in Forest. Ink, ink-2 and sand for the rest. At most four series.
- Source line under every chart: what is counted, n, period and source, in mono. Tag example data.
- Built in HTML and CSS, never pasted as a screenshot, so charts stay sharp in the PDF and the text stays searchable.
- Diagrams follow Diagrams and illustration: real labels, no icons standing in for words, solid for owned, dashed for rented.
- No pie charts, no 3D, no dual axes. One chart per slide.
07Speaker notes
- Write notes in
<aside class="notes">inside each slide. Two to four sentences: what to say, the caveat, where the number comes from. - Notes say what the slide does not. Never read the slide text aloud from the notes.
- Notes never appear in the PDF. Anything the client must keep goes on a slide or in the proposal.
- On a call, share the audience window or tab and keep the presenter view on your own screen. With one screen, use N instead.
08Presenting

| Feature | What it does | Rule |
|---|---|---|
| Shortcut bar | A 32px bar of clickable keys. Audience window: hidden; it fades in when the pointer rests on the top 8px for 300ms or on H, and fades out 1.5s after the pointer leaves. Never shown by navigation keys, clicks or a clicker, and suppressed while blank or laser is on. Shift+H turns it off in this browser; ?clean turns it off for one load. Presenter view: always on. | Keep the pointer off the top edge while sharing, or press Shift+H before you start. |
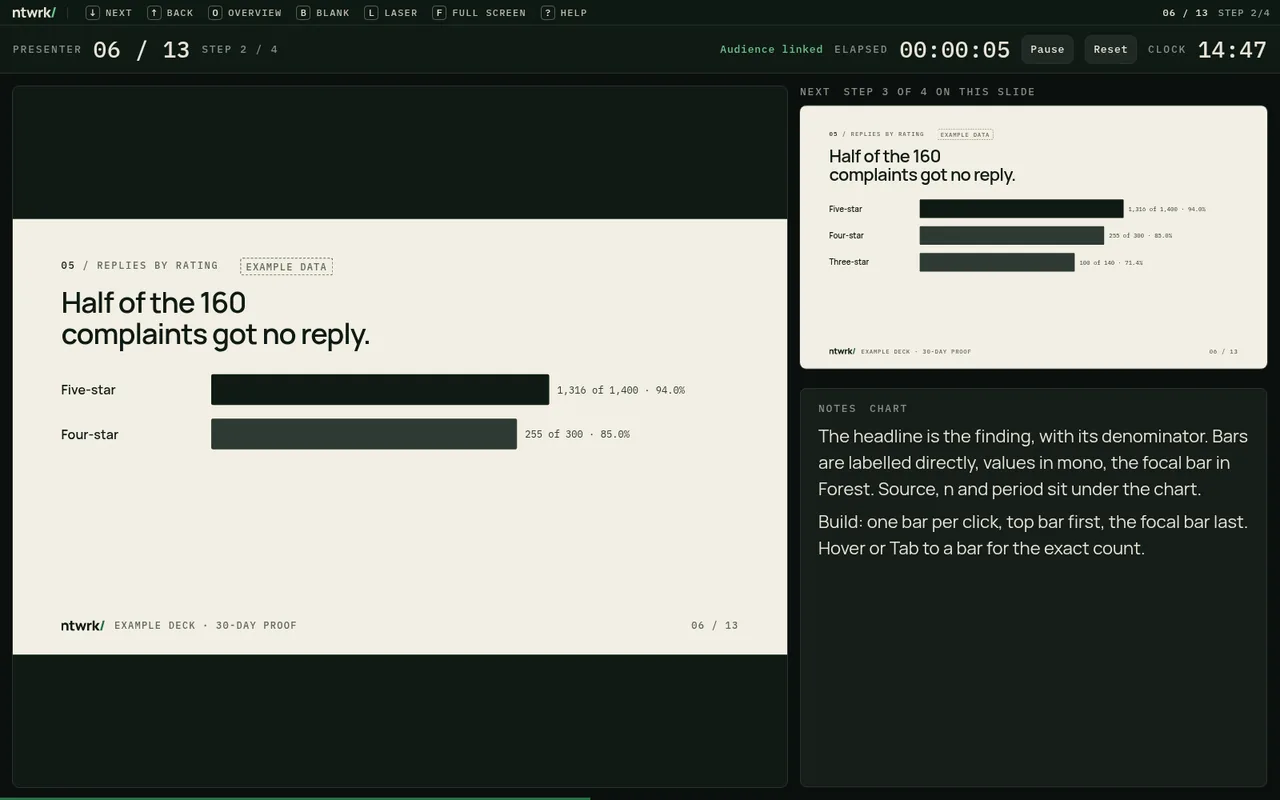
| Presenter view | P opens a second window synced to the audience window: current slide, next step or slide, notes, elapsed timer with pause and reset, 24-hour clock. Either window can drive. | Put the presenter window on your screen and the audience window on the projector or share. The audience window shows only the slide. |
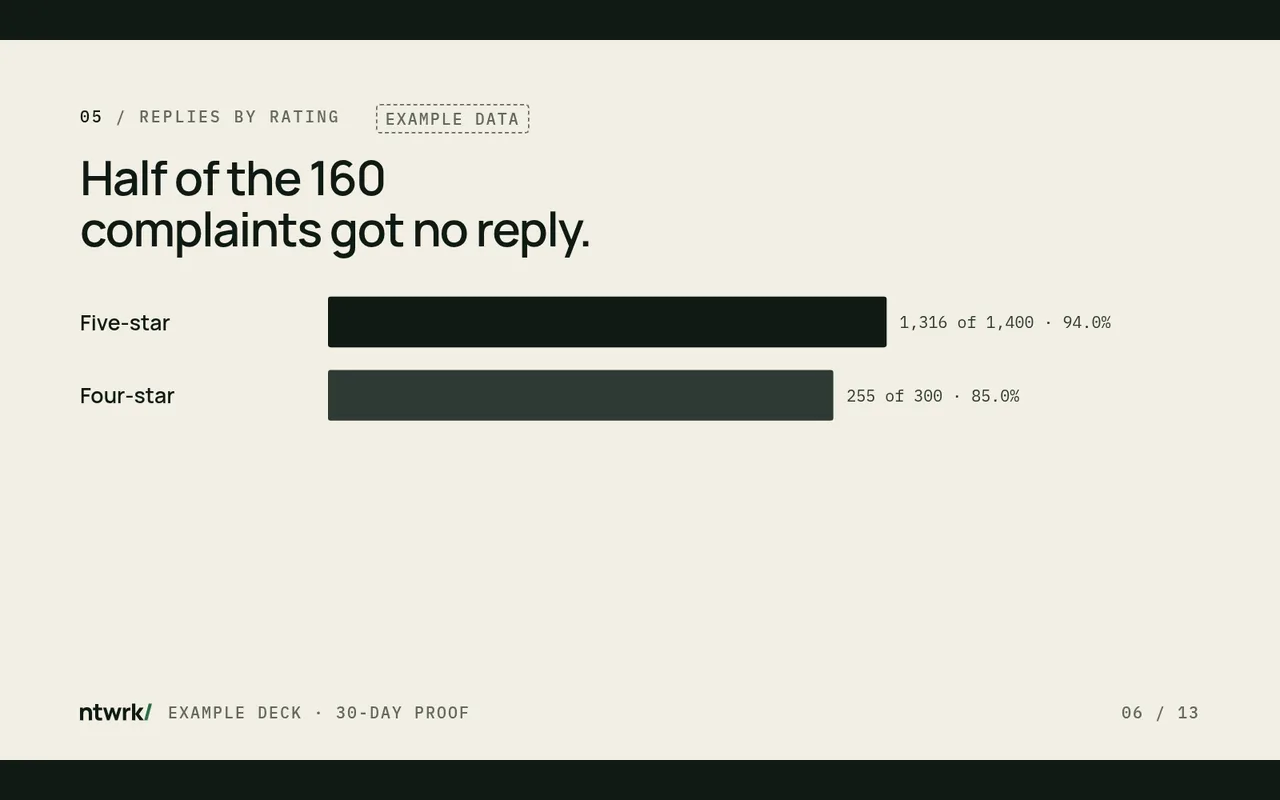
| Build steps | Add data-step="1", "2"... to elements. Each advance reveals the next group; back hides it. Same numbers reveal together. | Only for bars, steps and the two sides of a comparison. Four steps at most. Never hide the headline. Print and the overview show the final state. |
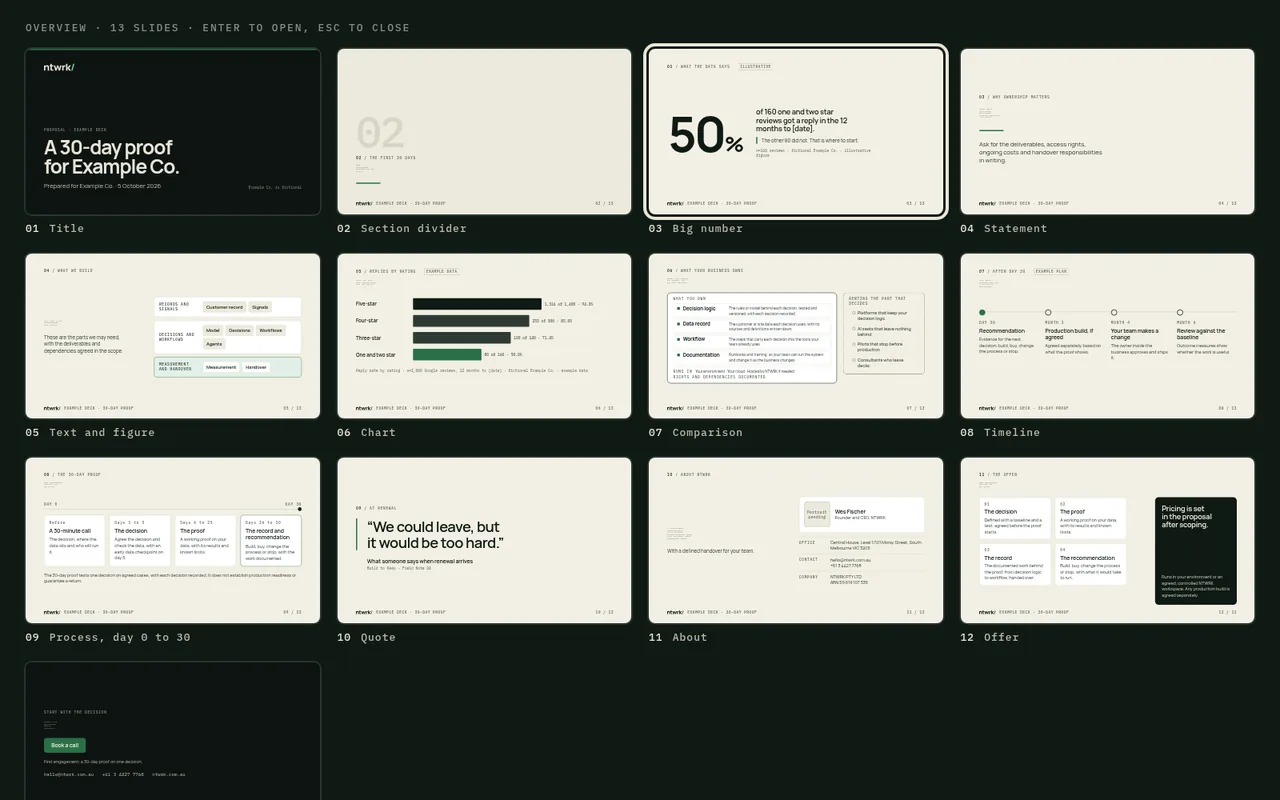
| Overview | O shows every slide as a thumbnail. Click or Enter to jump, Esc to close. | Use it for questions, not as a menu slide. |
| Black and white screen | B or . for black, W or , for white. Same key again to return. | Black the screen during discussion so the room looks at people. |
| Laser | Hold L, or tap it to toggle: a Forest dot follows the pointer. Moving it in the presenter view shows it on the audience screen. | Point, then let go. The dot never appears in the PDF. |
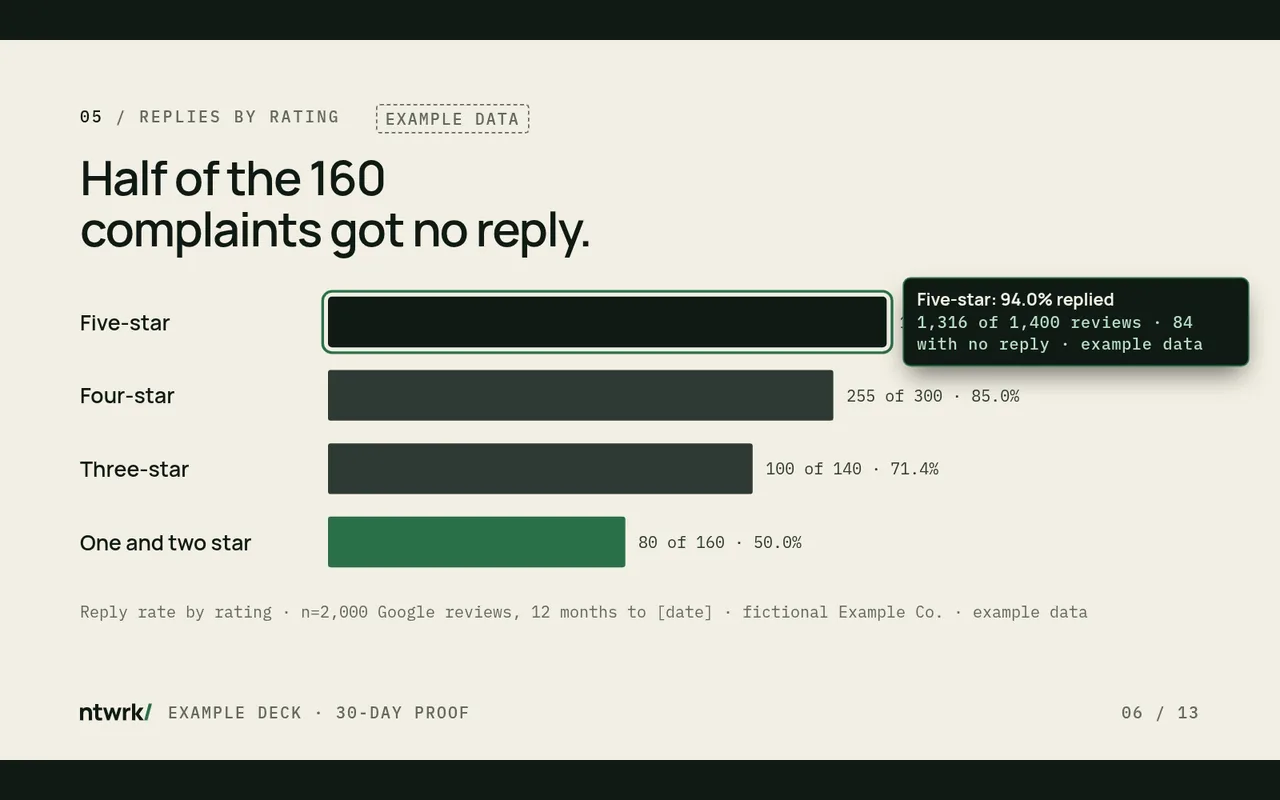
| Live chart values | Bars with data-tip="Label|value line" are focusable and show a tooltip on hover or focus. | The tooltip adds the exact count; the bar label and value stay on the slide. |
| Progress line | A 3px Forest line along the bottom of the presenter view shows how far through the deck you are. Hidden in the audience window unless the address has ?progress. | The audience sees the slide only. |
| Deep links | #/6 opens slide 6, #/6/2 slide 6 after two steps. Reload, Back and Forward keep your place. | Link to a slide, never to a step, when you send a deck. |
?presenter on the end of the address in a second window works too. Both windows must be in the same browser on the same computer.09PDF export and print
- Chrome or Edge: Ctrl or Cmd + P, Save as PDF, margins None, Background graphics on.
- The stylesheet sets the page to 1920 × 1080 and breaks after every slide: one slide per page, no controls, no notes. Check the page count matches the slide count.
- Name files
YYYY-MM-DD NTWRK [deck name].pdf, for example2026-10-05 NTWRK 30-day proof proposal.pdf. - Paper handouts: print the PDF at “Fit to page” on A4 landscape. Nothing on the canvas is smaller than 24px, so handouts stay legible at 11pt or more.
- Send the PDF, not the HTML folder, unless the client asked for the source. Decks with client data are never hosted at a public URL.
10Keyboard, clicker and touch
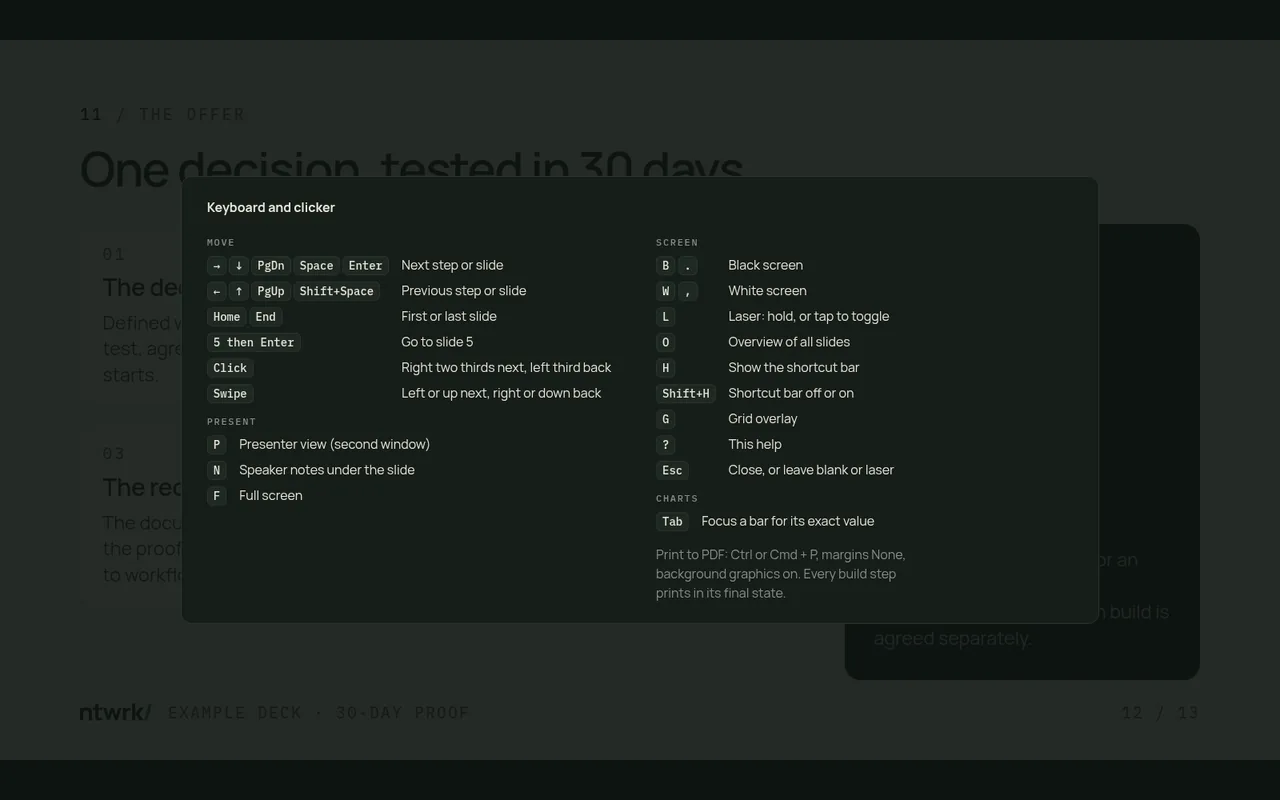
| Key | Action |
|---|---|
| → ↓ Page Down, Space, Enter | Next step, then next slide |
| ← ↑ Page Up, Shift + Space, Backspace | Previous step, then previous slide (at its final step) |
| Home / End | First / last slide |
| 5 then Enter | Go to slide 5 |
| P | Presenter view |
| N | Speaker notes under the slide |
| O | Overview |
| B or . | Black screen |
| W or , | White screen |
| L | Laser: hold, or tap to toggle |
| H | Show the shortcut bar |
| Shift + H | Shortcut bar off or on in this browser |
| G | Grid overlay |
| F | Full screen |
| Tab | Focus a chart bar for its value |
| ? | Shortcut help |
| Esc | Close help or overview, leave laser or blank, close notes |
Clickers work out of the box: most send Page Down and Page Up, and the blank button sends B or a full stop. Click the right two thirds of the screen to go forward and the left third to go back. On touch screens swipe left or up for next, right or down for back. The deck fills the window at 16:9 with ink letterboxing.
Addresses: #/6 slide 6, #/6/2 slide 6 at step 2, ?presenter presenter view, ?notes notes open, ?grid grid on, ?progress shows the progress line in the audience window, ?clean no shortcut bar or progress line, for screenshots.
11Accessibility
- Each slide is a labelled group (“4 of 13: Statement”), and slide changes are announced in a polite live region.
- Hidden slides are
inert, so keyboard focus and screen readers stay on the current slide. - The shortcut bar is a
role="toolbar"with one tab stop: Tab reaches it after the slide content and shows it, arrow keys move between keys, Esc leaves. Each key is a named button witharia-keyshortcuts; Blank, Laser and Notes report their state. Mouse clicks hand focus back to the slides so arrow keys keep moving the deck. The overview and help are dialogs that keep focus inside and return it on Esc. - Hidden build steps are
aria-hiddenuntil revealed, and each step is announced (“Step 2 of 4”). - Chart bars with values are focusable, named (“Five-star: 1,316 of 1,400, 94.0%”) and linked to their tooltip with
aria-describedby. - Charts carry a text alternative with every value. Logos have alt text “NTWRK”.
- The 150ms fade on slides, steps and the shortcut bar is the only motion and is removed under
prefers-reduced-motion. The laser dot is decorative and hidden from screen readers. - Contrast follows Colour: every text pairing on a slide passes AA. Type minimums are above.
lang="en-AU"on every deck. Chrome keeps the PDF text selectable and searchable.
12The HTML deck template
ntwrk-deck-template.zip
The template folder: sample deck, starter, tokens, fonts, logos, README. 117 KB.
OpenOpenSample deck
The 13-layout sample deck, running in the browser. Press P for the presenter view, ? for keys.
OpenOpenStarter
Title, statement and close, ready to copy.
Open| File | What it does |
|---|---|
index.html | Sample deck, one of each layout |
starter.html | Three-slide starting point |
css/tokens.css | Generated tokens; replace, never edit |
css/deck.css | Canvas, layouts, print rules |
js/deck.js | Navigation, shortcut bar, build steps, presenter view, overview, blank, laser, chart tooltips, deep links, notes, grid, help. No dependencies |
fonts/, img/ | Self-hosted fonts, outlined logos |